Classic chatbot analytics
Important
This article describes the metrics and data available for the classic chatbot analytics experience. By default, Copilot Studio uses analytics for modern agents. Classic chatbot analytics are available by request. Submit a request by contacting technical support.
The Summary tab of the Analytics page gives you a broad overview of your agent's performance. It uses artificial intelligence (AI) technology to show you which topics are having the greatest effect on escalation rate, abandon rate, and resolution rate.
Analytics sessions track user engagement with your agent and try to capture how well your agent handles user tasks. A single conversation can contain one or more analytics sessions. Each session is associated with a specific topic. The last non-system topic triggered—or the first system topic triggered, if no non-system topics were triggered—is associated with the analytic session.
The summary charts measure how well your agent is doing and help you find the topics that affect your agent's performance the most. A session will time out after 30 minutes of inactivity.
A session starts when a user interacts with your agent or the agent sends a proactive message to the user. The session begins in an unengaged state.
A session becomes engaged when one of the following occurs:
- a non-system topic is triggered
- the session is escalated
- the fallback topic is triggered
- the conversational boosting topic is triggered
Once the session becomes engaged, it remains engaged. An engaged session can have one of the following outcomes: resolved, escalated, or abandoned.
A session ends and is considered escalated when the Escalate topic is triggered or a Transfer to agent node is run. (The current analytics session ends, whether the conversation transfers to a live agent or not.)
A session ends and is considered resolved when either:
- The End of Conversation topic is triggered and the user confirms that the interaction was a success or lets the session time out.
- The Confirmed Success topic is triggered.
A session ends and is considered abandoned when an engaged session times out and it didn't reach a resolved or escalated state.
The summary tab includes various charts with graphical views of your agent's key performance indicators. The remainder of this article describes each chart in more detail.
Tip
- By default, the page shows you key performance indicators for the last seven days. To change the time period, use the date controls at the top of the page.
- Conversation transcripts for classic chatbot analytics in Dataverse are available approximately six hours after the analytic session starts.
Summary charts

The summary charts summarize the key performance indicators for the specified time period and the percent change over the period.
| Description | Details |
|---|---|
| Total sessions | The total number of sessions within the specified time period. |
| Engagement rate | The percentage of total sessions that became engaged. |
| Resolution rate | The percentage of engaged sessions that were resolved. |
| Escalation rate | The percentage of engaged sessions that were escalated. |
| Abandon rate | The percentage of engaged sessions that were abandoned. |
| CSAT | The graphical view of the average of customer satisfaction (CSAT) scores for sessions in which customers respond to an end-of-session request to take the survey. |
Engagement over time chart
The Engagement over time chart provides a graphical view of the number of engaged and unengaged sessions over time.
| Description | Details |
|---|---|
| Engaged | The daily number of engaged sessions. |
| Unengaged | The daily number of unengaged sessions. |
Session outcomes over time chart
The Session outcomes over time chart provides a graphical view of the daily resolution rate, escalation rate, and abandon rate over the specified time period.
| Description | Details |
|---|---|
| Resolved | The daily rate of resolved sessions. |
| Escalated | The daily rate of escalated sessions. |
| Abandoned | The daily rate of abandoned sessions. |
Resolution rate drivers chart
The Resolution rate drivers chart displays topics in order of their impact on the resolution rate over the specified time period.
| Description | Details |
|---|---|
| Topic | A Copilot Studio topic. |
| Rate | The percentage of engaged sessions for the topic that were resolved. |
| Impact | The topic's resolution rate impact score. The resolution rate impact score is the overall resolution rate including the topic minus the overall resolution rate excluding the topic. |
The chart displays the impact as a percentage. Topics with a positive impact percentage are topics with a higher than average resolution rate—they increased the overall resolution rate of your agent.
Increase the resolution rate of topics with high negative impact percentages to more quickly improve the overall resolution rate for your agent.
To see additional information about each topic, select the Detail link to display the topic details page. For more information, see Analyze topic usage.
Escalation rate drivers chart
The Escalation rate drivers chart displays topics in order of their impact on the escalation rate over the specified time period.
| Description | Details |
|---|---|
| Topic | A Copilot Studio topic. |
| Rate | The percentage of engaged sessions for the topic that were escalated. |
| Impact | The topic's escalation rate impact score. The escalation rate impact score is the overall escalation rate including the topic minus the overall escalation rate excluding the topic. |
The chart displays the impact as a percentage. Topics with a positive impact percentage are topics with a greater than average escalation rate—they increased the overall escalation rate of your agent.
Lower the escalation rate of topics with high impact percentages to more quickly decrease the escalation rate for your agent.
To see additional information about each topic, select the Detail link to display the topic details page. For more information, see Analyze topic usage.
Abandon rate drivers chart
The Abandon rate drivers chart displays topics in order of their impact on the abandon rate over the specified time period.
| Description | Details |
|---|---|
| Topic | A Copilot Studio topic. |
| Rate | The percentage of engaged sessions for the topic that were abandoned. |
| Impact | The topic's abandon rate impact score. The abandon rate impact score is the overall abandon rate including the topic minus the overall abandon rate excluding the topic. |
The chart displays the impact as a percentage. Topics with a positive impact percentage are topics with a greater than average abandon rate—they increased the overall abandon rate of your agent.
Lower the abandon rate of topics with high impact percentages to more quickly decrease the abandon rate for your agent.
To see additional information about each topic, select the Detail link to display the topic details page. For more information, see Analyze topic usage.
Analyze your agent's customer satisfaction metrics
The Customer Satisfaction tab of the Analytics page provides a detailed view of customer satisfaction (CSAT) survey data, including the average CSAT score, primary user query themes, and actionable insights on drivers of satisfaction or dissatisfaction with your agent's responses.
By default, the page shows key performance indicators for the last seven days. To change the time period, use the date pickers at the top of the page. You can retrieve data for any period within the last 45 days.
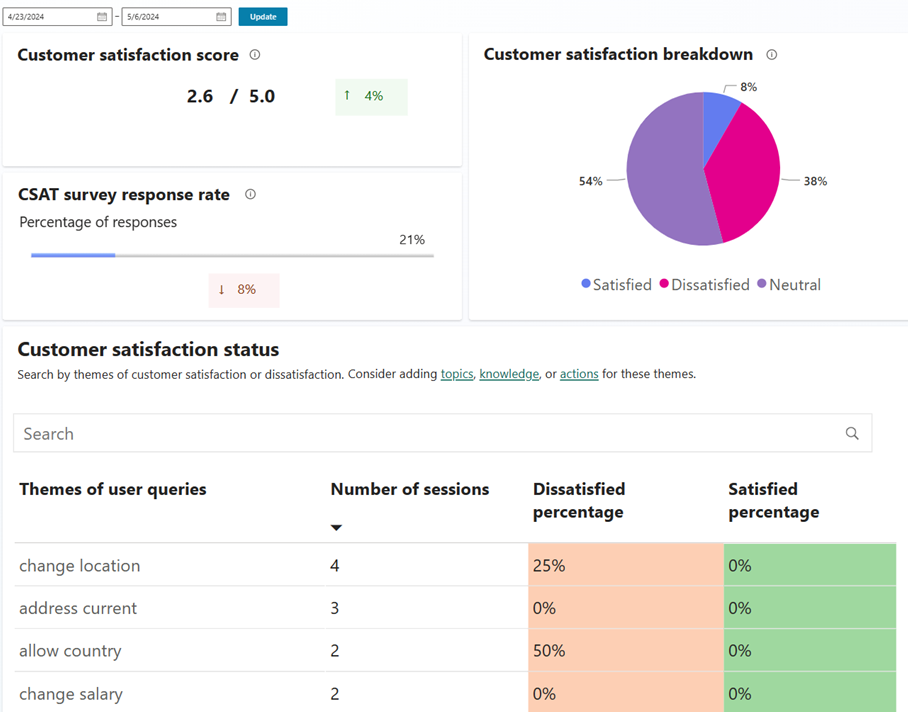
Customer satisfaction score
The Customer satisfaction score chart provides a graphical view of the average of CSAT scores for sessions in which customers respond to an end of conversation request to take the survey. The CSAT survey asks customers to rate their experience on a scale of 1 to 5. If a customer responds to more than one survey in the same session, only the most recent is used.
This chart also provides a period-over-period change indicator. For example, when you select a three-day period, the indicator shows the percentage change relative to the three days before the selected period. The period-over-period indicator only appears if your agent has CSAT survey data available for the prior period. If there are no CSAT survey data available for the same trailing period of time relative to what is selected in the filter, then the period-over-period indicator doesn't appear.
CSAT survey response rate
The CSAT survey response rate chart shows the number of end of conversation CSAT surveys that were presented and the percentage of surveys that were completed.
Customer satisfaction breakdown
The Customer satisfaction breakdown chart shows that percentage of sessions that were satisfied, dissatisfied, or neutral in the selected time period. The Customer satisfaction status pane provides more detail on the various signals used to determine session satisfaction status.
Customer satisfaction status
The Customer satisfaction status chart provides key insights on the themes users search for, and the satisfaction level of the users about the agent's responses. Sessions with similar themes are grouped together. The chart shows the number of sessions for each theme during the selected period, and the percentage of these sessions that were satisfied or dissatisfied. Sessions that weren't satisfied and not dissatisfied are considered neutral sessions and don't appear on this chart.
The theme of a given session is derived using ML models. Before being sent to the analytics dashboard, themes are processed to remove any personal data or sensitive information, such as phone numbers. Additionally, if themes contain profane or harmful language, these themes are masked.
To see the specific satisfaction or dissatisfaction drivers, hover over each segment of the chart. If any of the criteria are true for a given session, then the session is classified as satisfied or dissatisfied:
A session is considered dissatisfied if:
- The user gave two stars or less at the end of conversation survey.
- The user was asked to rephrase their query twice or more than twice in the (system fallback topic).
- The user abandoned the session.
- The user escalated the session to a live agent.
- The overall sentiment of the user about their conversation with the agent is classified as negative. Sentiment is determined using a publicly available ML model fine-tuned for sentiment analysis.
A session is considered satisfied if:
- The user gave four stars or more at the end of conversation survey.
- The user wasn't asked to rephrase their query more than once in the (system fallback topic).
- The session was resolved.
- The overall sentiment of the user about their conversation with the agent is classified as positive.
Sessions that don't meet any of the above criteria are considered neutral sessions and don't appear on this chart.
On the Summary tab of the Analytics page, you can use the Information icons to learn more about engagement, escalation, abandon, and resolution rates.
Theme and session sentiment extraction
Copilot Studio uses natural language processing (NLP) techniques to extract themes and assign sentiment to a given agent session.
For every session, Copilot Studio extracts themes from the first user utterance. Individual sessions with similar themes are aggregated, and appear as a single item on the Customer satisfaction status chart.
To evaluate session sentiment, the underlying NLP model is trained on public English language datasets. This process analyzes the text of the session to determine if the overall sentiment is positive, negative, or neutral. The process also preprocesses user queries to remove false positives. For example, this preprocessing ensures that a query such as "what is the best option?" isn't classified as positive solely because the word "best" appears in the query.