Hierarchies in Analysis Services
 Looking at that product dimension for my last post, I noticed that there were five hierarchies defined for the product dimension. A hierarchy is a very important part of any OLAP engine and allows users to drill down from summary levels down to detail levels much as you might want to zoom in on a virtual earth map to see your house from looking at the county you live in.
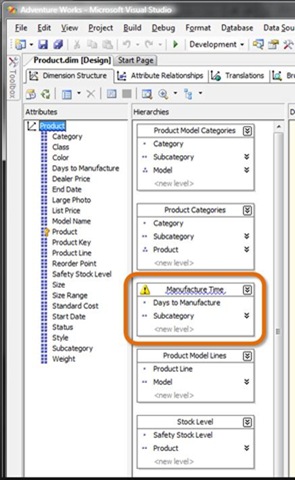
A good example of a hierarchy is Product Model Categories. All hierarchies start with an All level not shown here as it's a property of the hierarchy and you can decide what it's called e.g. All Products etc. The next level down is Category then Sub-Category and then Model. This type of hierarchy is called a natural hierarchy because a given Model only has one Sub-Category and a given Sub-Category only has one Category. In other words there is a one to many relationship between product and subcategory and another between subcategory and category. This makes for an efficient cube design which will be reflected in fast processing and query response times.
However how do you tell Analysis Services to do this. In its 2005 vintage you would change the attribute relationships by dragging attributes underneath each other on the attributes window above. There isn't a lot of help on this and it can be quite difficult to get the relationships correct. However the screen grab above is form CTP4 of SQL Server 2008 and no there is a New Attribute Relationships tab to show all this more clearly:
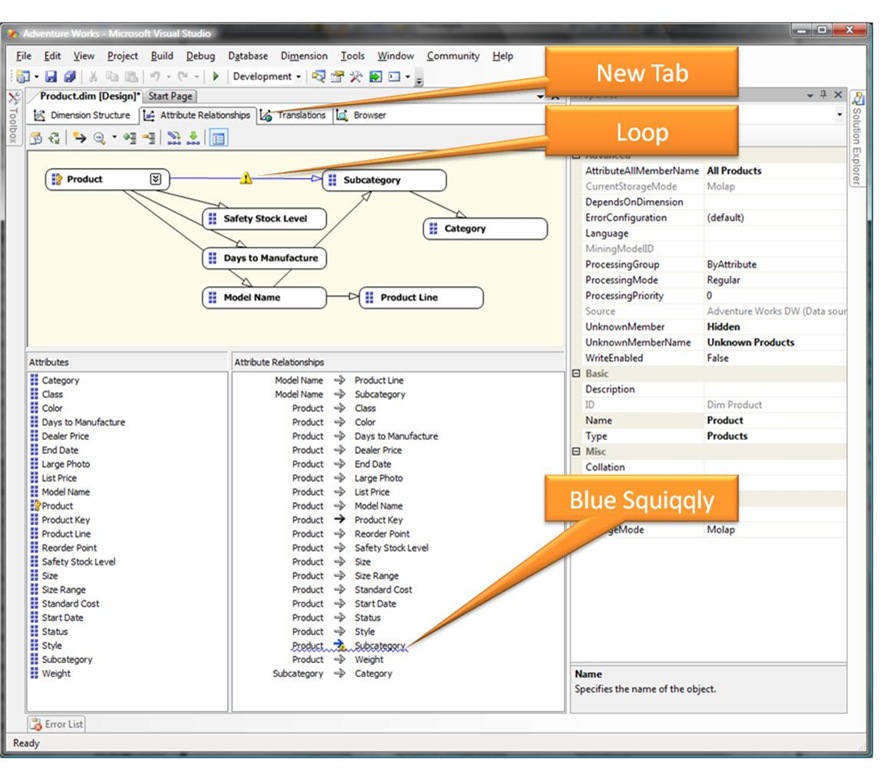
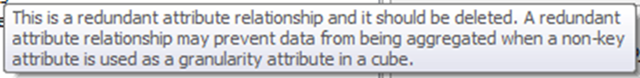
As I mentioned in my previous post blue squigglies are not good and in this diagram we can see that the sample product dimension has a redundant relationship between product and subcategory. As you expect hovering over either of these gives the nature of the warning:
Surely you could get rid of that and then you're sorted. Well no because if we do and then go back to the Dimension Structure tab you see that there is now a red squiggly under product and this is because Product is ordered by Sub-Category and now there is no relationship to get at this. So you have choices:
- Put up with a less than perfect design and leave the redundant relationship in
- Order product by something else and ignore your requirements spec
- Derive a new column to order products in the table or data source view based on Sub-Catgory.
So the blue squigglies are there to highlight potential performance problems, but what you do about them is up to you just like advice from any expert, your doctor, your accountant or your personal trainer!
Technorati Tags: BI, Business Intelligence, Analysis services 2008, Dimensions
Comments
Anonymous
May 19, 2009
We are having a tough time with a hierarchy on Transaction Descriptions. This field is a very low level field that can be sliced by GL and Cost Center Dimensions. The issue is that when you drill through the Transaction Dimension in Excel Pivot table function it is expands ALL data accross every GL and Cost when you are only interested in one. Having looked at the MDX if would appear there is not restriction on the GL or Cost and just says to show the Transaction Description. Is there any way this can be fixed in how we defined the hierarchy on Transaction Description in SSAS ?? Currently it is related to GL, Cost Center and one measure. It has three levels generic ALL level, another level with groupings and last one with details. HELP !Anonymous
May 20, 2009
Jodi I'm not a support guy but i can have a quick look at this if you can send me a screegrab or two of your hierarchies. Also are you using excel 2007? Andrew (afryer@microsoft.com)