Gain insights with dashboards
Dashboards in Dynamics 365 Sales offer a comprehensive view of actionable business data, enabling you to monitor and analyze key metrics across your organization. This article helps you understand how to utilize pre-built dashboards to gain insights into your sales team's performance and streamline your daily activities.
Dashboards use views, lists, and charts to bring data that's meaningful to you to one place.
Where to find dashboards
To open dashboards, select Dashboards in the site map.
Dashboards in Sales Hub app
The Sales Hub app includes prebuilt dashboards that provide quick insights into your sales data and team performance. The dashboards show daily work-related sales numbers, such as the activities you're working on, your sales pipeline, and your open opportunities and leads.
Sales reps or managers use the out-of-the-box Sales Pipeline chart to visualize the revenue for an opportunity based on each pipeline phase. More information: Understand the sales pipeline chart and its phases
Every sales dashboard includes a funnel chart that shows the number of opportunities in each stage of the sales pipeline and their estimated revenue. The funnel chart helps you visualize the sales pipeline and identify opportunities that need attention.
Sales Activity Dashboard
Use Sales Activity dashboard dashboard to track your sales targets and performance, and take action on your top opportunities and accounts. This dashboard provides a snapshot of your sales pipeline, sales targets, and activities. You can see a visual representation of your sales pipeline, top opportunities, goal target vs achievement, leads by source, your top accounts, and your activities.

Sales Activity Social Dashboard
Use the Sales Activity Social Dashboard to stay on top of your customer communications and take action on your top opportunities and accounts. This dashboard provides a snapshot of your sales pipeline, notifications about customer followups from assistant, and your activities. You can see a visual representation of your sales pipeline, top opportunities, notifications about customer communications, leads by source, your top accounts, and your activities. Learn more about assistant notifications.

Sales Dashboard
Use the Sales Dashboard to manage your daily activities efficiently and access your sales data quickly. This dashboard provides a list of activities assigned to you, open opportunities and leads, active accounts, and your sales pipeline.
The Sales dashboard is a multi-stream dashboard, where each stream shows a view of an entity.
Sales Performance Dashboard
Use Sales Performance Dashboard to track your sales performance and take actions to reach your sales targets. The dashboard provides a visual representation of your sales pipeline and detailed metrics about your sales performance. You can see your individual performance and the performance of your team.
Dashboards in Sales Professional app
The Sales Professional app comes with the following prebuilt dashboards that you can use to quickly get insights on your sales data and team performance.
Sales dashboard
Use Sales Dashboard to manage your daily activities efficiently and access your sales data quickly. This dashboard provides a list of open activities assigned to you, open opportunities and leads, and your phone calls.
The Sales dashboard is a multi-stream dashboard, where each stream shows a view of an entity.
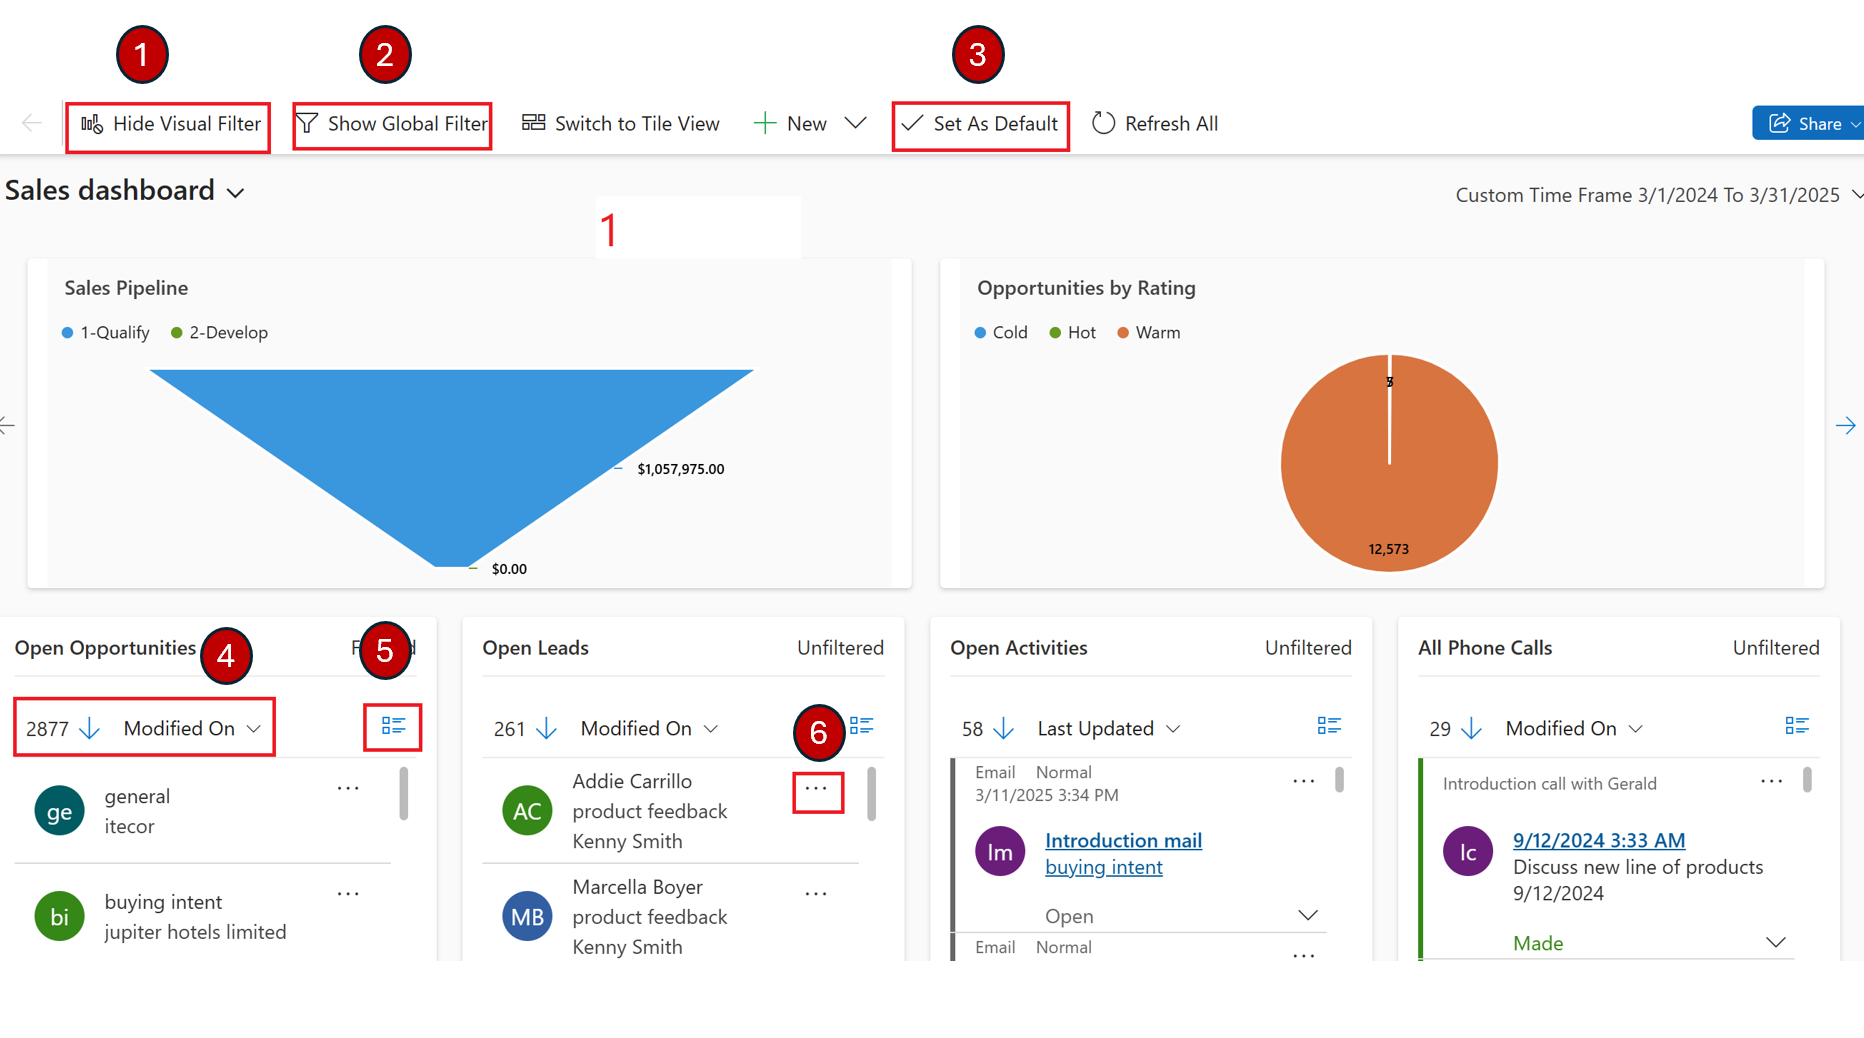
| Number | Action | Description |
|---|---|---|
| 1 | Apply/hide visual filters | Select a specific area in a visual filter chart (e.g., Hot area in Opportunities by Rating chart) to refresh the dashboard and streams to show filtered data. |
| 2 | Apply global filters | Select Show Global Filter on the command bar, choose a filter, and select Apply filter to drill down further into your data. |
| 3 | Set a dashboard as the default | Open the dashboard and select Set as Default in the site map to see it every time you sign in to Sales Professional. |
| 4 | Set the sort order | Select the field on which you want the data to be sorted in the stream. |
| 5 | Perform bulk actions | Select multiple records, then select the ellipsis (three-dot menu) to perform bulk actions on the selected records. |
| 6 | Take quick action on a record | Select the ellipsis (three-dot menu) next to a record in the stream to quickly qualify a lead or assign it to other users. |
Sales Manager Summary dashboard
Use the Sales Manager Summary dashboard to track your team's performance, identify opportunities that need attention, and help your team reach their sales targets. This dashboard provides a snapshot of your team's sales pipeline and performance.
The Deals Won vs. Deals Lost chart shows the number of opportunities won or lost by an owner. The dashboard also includes charts that show important financial data, such as estimated versus actual revenue by month.

Sales Professional Summary dashboard
Use the Sales Professional Dashboard to manage your daily activities efficiently, access your sales data quickly, and see your performance in the leaderboard. This dashboard provides a list of activities assigned to you, open opportunities and leads, active accounts, sales leaderboard, and your sales pipeline.

Table-specific dashboards
Apart from the sales dashboards, you can also view dashboards specific to a table/entity. These dashboards are available for Account, Contact, Lead, Opportunity, Quote, and Invoice tables.
To see table-specific dashboard, open the table in your sales app. For example, select Opportunities on the sitemap and then on the command bar, select More commands (three-dot menu) > Open Dashboards. Select Show Visual Filter to see the charts.

You can use the global or visual filters to show only the data that's important to you.