Use the Viva Glint Driver Impact report
Drivers are factors that affect employee engagement; a driver's impact is its correlation with employee engagement in the current world of work. Strengths and Opportunities (S&Os) for creating Focus Areas and action plans are derived from driver impact data.
There can be a significant difference in how important a specific driver of engagement is to one team compared to another team, or to the rest of the company. For example, the engineering team's engagement level may be highly impacted by a lack of career growth opportunities, whereas the finance team may have been overworked this quarter and thus work-life balance impacts them the most. Key drivers vary within organizations and populations.
Watch this video about using the Driver Impact Report.
Settings on the Driver Impact report
The default Driver Impact Report is set at the client level and is either an internal benchmark comparison or an external benchmark comparison. This comparison dictates what appears on the dashboard for all reports, across all programs. Comparison groups can be changed, but the views revert to the default settings upon logging off or changing views.
Understand the four comparison settings
One or more internal benchmark comparisons may be available to view feedback, based on how benchmarks are configured in the Reporting section of your General Settings feature.
The four Glint benchmark comparison options are:
- Benchmark: Provides a comparison point for feedback based on survey data compiled from all Glint customers, not just within your organization. Helpful for admins and first-time survey results analysis.
- Company: Displays team scores in comparison to company-wide scores for the same questions. Helpful for users with more than one area of responsibility.
- My Teams: Compares a team's score to an overall score derived from a user’s data access. Helpful for users with more than one area of responsibility.
- Average Question: Presents a single, overall score for all questions and respondents within your access. Helpful for users looking for some level of variance in their score.
Learn more about comparison data.
Derive Strengths and Opportunities (S&Os) from the Driver Impact report
The algorithm used to identify S&Os is composed of item scores, impact on engagement, and relativity of the score to a benchmark comparison.
Strengths are areas that the team should celebrate. Opportunities are areas the team should work on to improve overall engagement (or the survey's intended key outcome).
Watch this video for a quick summary of strengths and opportunities.
To determine a driver's impact, individual survey responses are analyzed to determine how closely aligned scores are to each driver and the outcome variable (typically engagement). A driver's impact is classified as high when this is true:
- Employees who rate a driver high, also rate engagement high
- Employees who rate a driver low, also rate engagement low
If a driver's score isn't related to engagement, then it has low or zero impact. Knowing which drivers have a high impact allows managers to focus on improving the scores of drivers that matter the most.
View Strengths & Opportunities versus Company
Managers should first look at the Strength & Opportunity report versus Company or another internal comparison, if available. While Benchmark is a valuable comparison, most often Company is more informative because the comparison is internal.
A manager with scores below company average should focus on the items with the biggest gaps as those reflect the greatest opportunity for improvement. For this reason, the Take Action button defaults to the Opportunities section of the S&O report.
Managers with scores above Company can change to view S&O vs. Benchmark to gain a sense of what areas may help to close gaps.
If you're looking at Company results* and the default comparison is also Company, the driver analysis shows Average Question as the comparison - otherwise there would be no comparison ratio.
Apply filters
Applying filters allows leaders to look at Strengths and Opportunities for specific groups. To apply a filter:
- Select the filter symbol at the top of the page.
- Select + Add Filters.
- From the dropdown menu, choose a filter from the People or Question Responses section.
Driver Impact graph view
When a user navigates to the Driver Impact Report, the default view is graph format. The graph plots each driver's impact on the x-axis and the selected comparison on the y-axis. The comparison can include an internal benchmark or an external benchmark.
Items on the right side of the graph have a high statistical correlation with the selected outcome (typically engagement or eSat) across all the respondents in a group. Often a person rates a driver and its corresponding outcome the same. For this reason, acting on those items likely has the biggest impact on engagement (or the selected outcome).
In determining Strengths and Opportunities, the platform considers the distance to the comparison point and the impact on the key outcome. Only items with a High or Very High impact are considered when determining strengths and opportunities. Of these, the ones relatively highest in relation to the comparison are marked as Strengths, and the ones relatively lowest in relation to the comparison are marked as Opportunities. Based on this analysis, a rank ordered list of items is displayed:
- Relative Strengths are indicated by points with a bold white dot.
- Relative Opportunities are indicated by a red dot.
Note
If there are less than two eligible items ranked, the Strengths & Opportunities section is hidden on a user's dashboard. This happens when:
- There are insufficient results.
- All items have low or medium impact.
- A user is on a report filtered to only one item.
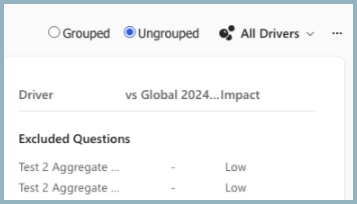
Driver Impact table view
The Driver Impact table view displays the top three Strengths and Opportunities, exactly as managers see them on their Strengths & Opportunities report. Selecting Show more displays all Strengths and Opportunities. Select Show less to hide them.
The circle next to each driver's name indicates the impact level and score in relation to the comparison:
- A filled circle indicates the highest impact.
- A partially filled circle indicates relatively lower impact.
- Blue indicates that the item scored above the comparison.
- Red indicates that the item scored below the comparison.
Table view example:
Small teams using the Driver Impact report
The algorithm used to determine driver impact scores includes a statistical test to determine if it has enough data points to establish a significant correlation.
A minimum number of 20 respondents is the default threshold to determine whether to show impact scores for a team. Managers of teams that don't meet the minimum number of respondents see their S&Os based on the impact calculated at the Company level. This method provides the most statistically sound results.
Key points for managers with fewer than 20 respondents:
- S&Os on the dashboard are the areas a manager's team scored relatively high or low in relation to the comparison. These areas have the strongest impact on engagement at the larger company level; they impact isn't reflective of your team specifically. The dashboard doesn't show impact scores at the team level if there are fewer than 20 respondents.
- One manager's S&Os may be different from other leaders within their organization.
- If enabled, including [Broader Team Insights (BTI)](/viva/glint/reports/broader-team-insights into conversations provides understanding for what drives engagement closer to the manager's own level in their organization.