Tips and tools for troubleshooting your Azure IoT Operations instance
This article describes how to use some common tools when you're learning, exploring, or troubleshooting your Azure IoT Operations instances. These tools are in addition to the capabilities provided by the Azure portal, Azure CLI, operations experience web UI, and observability resources.
Kubernetes tools
Azure IoT Operations components run in a standard Kubernetes cluster. You can use the kubectl and k9s CLI tools to interact with and manage your cluster.
kubectl
kubectl is the Kubernetes command-line tool for managing your cluster. It has many capabilities that you can learn about in the official kubernetes documentation. This article describes the common uses for kubectl when you're working with Azure IoT Operations such as listing the running pods and viewing logs.
Configure kubectl to connect to your instance
The Prepare your Azure Arc-enabled Kubernetes cluster article describes how to configure kubectl to connect to your k3s cluster when you run kubectl commands on the same machine where you deployed your Kubernetes cluster.
Tip
Add the export KUBECONFIG=~/.kube/config command to your .bashrc or .bash_profile file so that you don't have to set the KUBECONFIG environment variable each time you open a new terminal window.
If you deployed your Azure IoT Operations instance to an Arc-enabled AKS-EE, the kubectl configuration is automatically set up for you. You can run kubectl commands directly from the command line on the machine where you deployed your cluster.
It's also possible to run kubectl commands from your local client machine rather than the machine where you deployed your Arc-enabled cluster:
As a one-time step, use SSH to connect to the machine where you deployed your cluster and run the following commands. Be sure to replace <your-name> with your name:
kubectl create serviceaccount <your-name> -n default
kubectl create clusterrolebinding <your-name>-binding --clusterrole cluster-admin --serviceaccount default:<your-name>
kubectl apply -f - <<EOF
apiVersion: v1
kind: Secret
metadata:
    name: <your-name>-secret
    annotations:
        kubernetes.io/service-account.name: <your-name>
type: kubernetes.io/service-account-token
EOF
TOKEN=$(kubectl get secret <your-name>-secret -o jsonpath='{$.data.token}' | base64 -d | sed 's/$/\n/g')
echo $TOKEN
Make a note of the token. You use this token to authenticate when you run kubectl commands on your client machine. You can now disconnect from the machine running your Kubernetes cluster.
To use kubectl on your client machine to connect to the cluster, open two terminals:
In the first terminal, run the following command to configure a proxy to connect to your cluster. Be sure to replace the values for the three placeholders:
az connectedk8s proxy -n <your-arc-enabled-cluster-name> -g <your-arc-enabled-cluster-resource-group> --token <token-from-previous-step>Leave this terminal open while you run
kubectlcommands in the second terminal.In the second terminal, you can run your
kubectlcommands against your remote cluster. For example, to list the pods in theazure-iot-operationsnamespace:kubectl get pods -n azure-iot-operationsTip
You can also run commands, such as
k9s, that use thekubectlconfiguration in this terminal.The
kubectlcontext remains set to the remote cluster until you close your first terminal.
To learn more, see Use cluster connect to securely connect to Azure Arc-enabled Kubernetes clusters.
Namespaces
By default, Arc and Azure IoT Operations use the following namespaces in the Kubernetes cluster:
azure-iot-operationsfor the Azure IoT Operations components.azure-arcfor the Azure Arc-enabled Kubernetes components.
Tip
To view all the namespaces in your cluster, run the following command: kubectl get namespaces.
Common kubectl commands
To view all the pods running in the azure-iot-operations namespace, run the following command:
kubectl get pods -n azure-iot-operations
The output looks like the following example:
NAME                                              READY   STATUS      RESTARTS       AGE
adr-schema-registry-0                             2/2     Running     0              19m
adr-schema-registry-1                             2/2     Running     0              19m
aio-akri-agent-777477bc68-72lrg                   1/1     Running     7 (83m ago)    21d
aio-broker-authentication-0                       1/1     Running     7 (83m ago)    21d
aio-broker-backend-1-0                            1/1     Running     11 (82m ago)   21d
aio-broker-backend-1-1                            1/1     Running     7 (83m ago)    21d
aio-broker-diagnostics-probe-0                    1/1     Running     11 (83m ago)   21d
aio-broker-diagnostics-service-0                  1/1     Running     7 (83m ago)    21d
aio-broker-fluent-bit-6bkf2                       1/1     Running     0              16m
aio-broker-frontend-0                             1/1     Running     12 (83m ago)   21d
aio-broker-health-manager-0                       1/1     Running     14 (82m ago)   21d
aio-broker-operator-0                             1/1     Running     7 (83m ago)    21d
aio-broker-upgrade-status-job-1.0.4-bwlcc         0/1     Completed   0              77m
aio-broker-webhook-admission-65d67f8ddc-jct9j     1/1     Running     0              82m
aio-dataflow-admission-webhook-84dd44c8bd-6pw58   1/1     Running     7 (83m ago)    21d
aio-dataflow-operator-0                           1/1     Running     14 (83m ago)   21d
aio-dataflow-upgrade-status-job-1.0.5-msmf4       0/1     Completed   0              77m
aio-opc-asset-discovery-54649d46cf-kb6qs          1/1     Running     2 (83m ago)    17d
aio-opc-media-1-785748ff6c-qkhgl                  1/1     Running     1 (83m ago)    14d
aio-opc-opc.tcp-1-858b9ff67-dxwvb                 1/1     Running     4 (80m ago)    17d
aio-opc-supervisor-5d6b9bfc49-fgt7d               1/1     Running     2 (83m ago)    17d
aio-operator-7b9b585dc6-bvfpd                     2/2     Running     0              19m
aio-usage-28946280-f42k8                          0/1     Completed   0              14d
aio-usage-28946340-45grx                          0/1     Completed   0              14d
aio-usage-28946400-znn7v                          0/1     Completed   0              13d
aio-usage-28946460-nrw4z                          0/1     Completed   0              13d
aio-usage-28966500-mrcmf                          0/1     Completed   0              55m
To view the logs for a specific pod such as the aio-opc-opc.tcp-1-858b9ff67-dxwvb pod, run the following command:
kubectl logs aio-opc-opc.tcp-1-858b9ff67-dxwvb -n azure-iot-operations
To view a human-readable description of a specific pod such as the aio-opc-opc.tcp-1-858b9ff67-dxwvb pod, run the following command:
kubectl describe pod aio-opc-opc.tcp-1-858b9ff67-dxwvb -n azure-iot-operations
In some places, the Azure IoT Operations documentation uses the kubectl apply command to apply a Kubernetes manifest file to make a configuration change in the cluster.
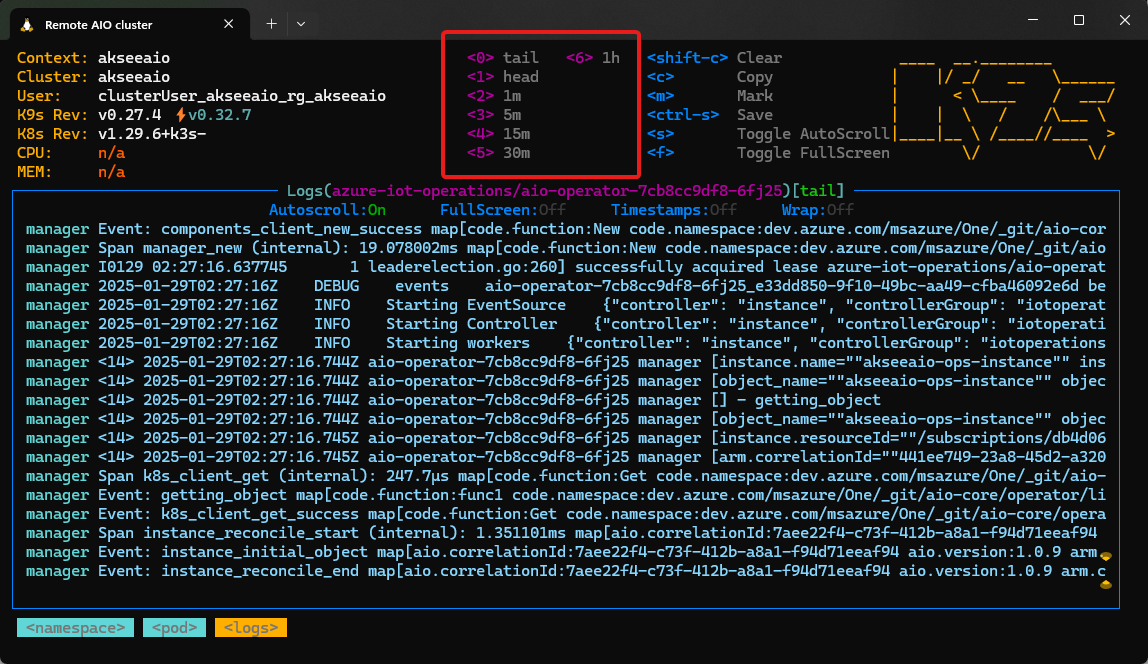
k9s
The k9s utility offers a terminal-based UI for managing your Kubernetes cluster. It uses your kubectl configuration to connect to your cluster and provides a visual way to interact with your cluster. Its default view lists all the pods currently running in your cluster:

When you're working with Azure IoT Operations, you can filter the view to show only the pods in the azure-iot-operations namespace.
Type
:to open the command panel, then typensand press Enter.In the list of namespaces, select
azure-iot-operationsand press Enter.The list of pods now shows only the pods in the azure-iot-operations namespace:

Tip
You can now use the number keys to apply filters. The previous screenshot shows that 0 shows all pods, and 1 shows only the pods in the azure-iot-operations namespace.
You can use shortcut keys to view information about your pods. For example:
To describe a pod, select it in the list and press d.

To view the logs for a pod, select it in the list and press l.
Tip
You can use the number keys to navigate around the log file.
To view custom resource types other that pods in the cluster:
Press Ctrl-a to display the list of custom resource types.
Select the custom resource type, such as assetendpointprofiles and press Enter.
Tip
To search for a custom resource type by name, type / and then start typing the name of the type you're looking for.
Select a custom resource and choose one of the available operations. For example, you can view the YAML definition os an asset endpoint profile by selecting it and pressing y. For some resources, you can edit the configuration.
The following table describes some of the custom resource types you might work with in Azure IoT Operations:
| Custom resource type | Description |
|---|---|
assetendpointprofiles |
Represents the configuration for an asset endpoint. |
assets |
Represents the configuration for an asset. |
brokers, brokerlisters, brokerauthentications, brokerauthorizations |
Represent the configuration for an MQTT broker. |
dataflows, dataflowendpoints, dataflowprofiles |
Represent the configuration for a data flow. |
secrets, secretsyncs, secretproviderclasses |
Represent the configuration for secrets and secret management. |
MQTT tools
When you're learning about and testing the MQTT broker in your Azure IoT Operations instance, you can use MQTT client tools to interact with the broker. However, for security reasons Azure IoT Operations doesn't expose the MQTT broker outside of the cluster. As a work-around, you have the following options:
Caution
These three approaches are only suitable for development and test environments. Under no circumstances should you use them in a production environment.
Connect to the default listener inside the cluster. This option uses the default configuration and requires no extra updates. You're limited to a small set of MQTT client tools.
Use a
NodePortservice to expose the MQTT broker outside of the cluster. This option requires you to update the configuration of the MQTT broker. You can use any MQTT client tools that support connecting to a specific port.Use a
LoadBalancerservice to expose the MQTT broker outside of the cluster. This option requires you to update the configuration of the MQTT broker. You can use any MQTT client tools that support connecting to a specific port.
Connect to the default listener inside the cluster
To connect to the default listener inside the cluster, you can deploy a pod that runs CLI-based MQTT client tools such as mosquitto_sub and mosquitto_pub. The following command deploys such a pod to your cluster:
kubectl apply -f https://raw.githubusercontent.com/Azure-Samples/explore-iot-operations/main/samples/quickstarts/mqtt-client.yaml
After the pod is running, you can connect to a shell in the pod:
kubectl exec --stdin --tty mqtt-client -n azure-iot-operations -- sh
Use this shell to run commands such as mosquitto_sub and mosquitto_pub to interact with the MQTT broker. For example, to subscribe to all topics under the azure-iot-operations/data topic:
mosquitto_sub --host aio-broker --port 18883 --topic "azure-iot-operations/data/#" --verbose --cafile /var/run/certs/ca.crt -D CONNECT authentication-method 'K8S-SAT' -D CONNECT authentication-data $(cat /var/run/secrets/tokens/broker-sat)
Notice how the command loads a certificate file and a token from the pod's file system. The mqtt-client.yaml manifest file mounts these files into the pod.
To receive a single message from the azure-iot-operations/data/thermostat topic, add the -C 1 option:
mosquitto_sub --host aio-broker --port 18883 --topic "azure-iot-operations/data/thermostat" -C 1 --verbose --cafile /var/run/certs/ca.crt -D CONNECT authentication-method 'K8S-SAT' -D CONNECT authentication-data $(cat /var/run/secrets/tokens/broker-sat)
To view the MQTT v5 user properties in the messages, use the -F %P option:
mosquitto_sub --host aio-broker --port 18883 --topic "azure-iot-operations/data/thermostat" -V mqttv5 -F %P --cafile /var/run/certs/ca.crt -D CONNECT authentication-method 'K8S-SAT' -D CONNECT authentication-data $(cat /var/run/secrets/tokens/broker-sat)
To publish a message to the azure-iot-operations/data/valve topic:
mosquitto_pub --host aio-broker --port 18883 --topic "azure-iot-operations/data/valve" --message "open:15%" --id "controller" --cafile /var/run/certs/ca.crt -D CONNECT authentication-method 'K8S-SAT' -D CONNECT authentication-data $(cat /var/run/secrets/tokens/broker-sat)
When you finish using the MQTT client tools pod, you can delete it from the cluster:
kubectl delete -f https://raw.githubusercontent.com/Azure-Samples/explore-iot-operations/main/samples/quickstarts/mqtt-client.yaml
To learn more about this configuration, see Connect to the default listener inside the cluster.
Use a NodePort or LoadBalancer service
If you follow the steps to configure a Node port or Load balancer service to expose the MQTT broker outside of the cluster, you can use any MQTT client tools that support connecting to a specific port. The following examples assume that you configured the service with no authentication, authorization, or TLS. You can now use your favorite MQTT client tools to connect to the MQTT broker on port 1883 if you're using a load balancer or the configured port if you're using a node port.
For example, to run the open-source mqttui tool on the machine where your Kubernetes cluster is running, use the following command:
mqttui --broker mqtt://localhost:1883
Tip
If you configured a load balancer and port 1883 is open on the host machine's public IP address, you can use the following command to connect to the MQTT broker from a different machine: mqttui --broker mqtt://<cluster-machine-public-ip>:1883
You can use the mqttui tool to subscribe to topics, publish messages, and view the messages that are flowing through the broker:

To display the messages on a specific topic such as azure-iot-operations/data/thermostat, use the following command:
mqttui --broker mqtt://localhost:1883 azure-iot-operations/data/thermostat
To publish a message to the azure-iot-operations/data/valve topic, use the following command:
mqttui publish --broker mqtt://localhost:1883 azure-iot-operations/data/valve open:15%
To run the open-source MQTT Explorer tool on the machine where your Kubernetes cluster is running, use the following configuration:

To run the open-source MQTT Explorer tool on your local machine to connect to the machine where your Kubernetes cluster is running, use the following configuration:

Make sure that MQTT Explorer has at least the # topic configured:

After you connect, you can see messages in the topics you subscribed to and publish messages:
